Indicator Diagrams

The diagrams indicating, simultaneously, the pressures and the relative position of the piston in the engine cylinder are known as indicator diagrams.
The Indicator diagram has the following purposes:
  • To enable evaluation of the power developed in each engine cylinder.
  • To highlight conditions during fuel injection, combustion and after burning.
  • To highlight conditions prevailing in the cylinder during scavenge/exhaust gas exchange process.
  • To show the pressure variation in the cylinder with respect to piston displacement.


Indicator Instrument 
It is the instrument used to obtain indicator diagrams. It consists of a small cylinder in which a spring loaded piston can move backwards and forwards. The cylinder space below the piston can be connected to the combustion, chamber of the engine. The indicator piston will move in accordance with the variations in the pressure prevailing in the cylinder. 


The reciprocating movement, of the indicator piston is amplified and transferred by means of a link and mechanism to a pen. This pen can be brought into contact with indicator paper placed on the drum, which, by means of a cord drive and a long coil spring, is made to rotate in accordance with the movement of the piston in the cylinder of the engine. This can be achieved by connecting the cord drive, by means of a lever Mechanism, to the crosshead of the unit where indicator diagram is taken. In some engines a shaft is provided which rotates at the same speed as the crankshaft. The indicator drive cams are mounted on this shaft. By means of a 'change over arrangement, the operating lever can be connected in turn to each cam. thus providing the possibility of moving the indicator drum in correct-rhythm. 


Planimeter 
In order to determine the indicated power, a set of indicator diagrams is taken consisting of one diagram for each cylinder. The area of the diagrams, and the indicated mean pressure, is determined by means of a planimeter.


 An arm of the planimeter has a needle point which is pressed into the board and loaded by a weight to hold this part in position during operation. The tracing point, in form of a needle or a magnifying glass with a center mark, which is moved over the outline of the diagram. The rollers, fitted on the hinged ends, which is in contact with the board, revolved as the outline of the diagram is traced. The area of the diagram is read off from the counter and Vernier. Calibration of the instrument required to check by measuring a known area. By using the scale of the spring used and by dividing the area by the length of the diagram mean effective pressure can be obtained. This MEP is further used to calculate the indicated power. . 


Taking Indicator Diagram
Before taking diagram, open indicator cock, two or three firing strokes, to blow out soot and combustion residues in the cock. Check whether the spring fitted on the indicator instrument will meet the peak pressure to be expected. Stretch diagram paper firmly over the drum. After drawing atmospheric line, hook the cord to indicator drive, open indicator cock, and take power diagram and shut the cock. Remove hook, turn the drum by hand to a place clear from the power diagram, take compression pressure line with fuel cutoff. Having taken indicator diagram from all cylinders, open the indicator instrument and clean all parts, especially the piston, thoroughly. After cleaning, apply high temperature grease into the surface of all parts. 
Note: Do not allow indicator instrument to become overheated by too many firing strokes as it will affect the instrument accuracy.


Power Card
It is taken with the indicator drum in phase with piston movement. The area within this diagram represents the work done during the cycle.
The fresh charge of air is trapped in the cylinder by the closing of air inlet and exhaust valves or ports at point (1). from (1) to (2) it is compressed raising its pressure and temperature.


At this point fuel is injected into the cylinder, the temperature of the hot compressed air is high enough to cause it to ignite and combustion takes place resulting in a rapid rise in pressure to point (3).
By now the piston has commenced to move outwards, allowing the burning gases to expand so that pressure falls, although combustion continues until point (4).
Expansion without combustion takes place from (4) to (5) when the exhaust valves or ports open causing a rapid fall in pressure as the gases are released from the cylinder.
During the period 5-6-1 the burnt gases in the cylinder are displaced by the incoming charge of fresh air and it is trapped at (1) as the valves or ports close, ready to begin the cycle again. 


Draw card
An out-of-phase diagram is required to be taken off if the compression pressure is to be accurately determined. It is taken by hand instead of the engine gear and cord connection pulling round the indicator paper dram. The paper dram should be smartly pulled by hand just as the engine is passing over the top centre. The diagram obtained shown clearly the pressure changes during compression and combustion. It is now becoming standard practice to fit a special indicator cams for taken off out-of-phase diagrams. The cam for this diagram is arranged 90° out-of-phase to the cam used for taken other diagrams.


Compression Diagram
It is taken like a power diagram, but with fuel cut-off. The height of this diagram represents compression pressure of the cylinder, if the diagram is formed nearly one line. i.e. compression and expansion lines coincided, it is perfect.


Light Spring Diagram
Light spring diagrams are taken for determining the pressure in the cylinder during the exhaust and scavenging periods is taken with the indicator drum movement in phase with piston movements, fuel pump engaged, but with a light spring fitted to the indicator.

Analysis of Out Of Phase Diagrams:

a. Early ignition 


Ignition point starts earlier resulting in a higher Pmax, but  Pcom is the same. Exhaust temperatures decrease and it may cause knocking. It is corrected by adjusting the FQS setting for bad quality fuel or injection timings.


b. Late ignition after-burning


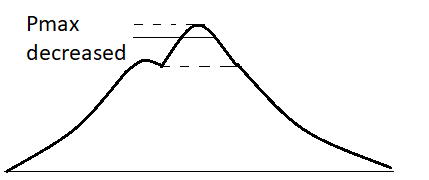
Observe that the ignition point starts later and Pmax is lower but Pcom is the same. Exhaust temperature decrease as more fuel is burnt later and smoke increases. The cause are wrong fuel pump timings, camshaft drive wear, worn fuel pump plunger, faulty delivery valve or suction valve spring, injector nozzle trumplets, or worn injector holes.


c. Pressure Oscillations.


Observe the oscillations are due to the gas column or indicator drive. To use this diagram, take the mean of the oscillation amplitude to get the curve.
 

d. High compression pressure
Observe that the Pcom is high, resulting in a higher Pmax. Ignition point is higher although there is late ignition.


e. Low compression pressure
Observe Pcom is lower, resulting in a lower Pmax and early ignition.


f. Leaky exhaust valve or worn piston rings


Observe Pcom is lower and ignition point is later. Pmax and exhaust temperature increases, while power decreases.


g. Overloaded engine
Observe Pcom is higher and Pmax is higher. exhaust temperature and smoke increases.


h. Leaky injector or a worn fuel pump


Observe Pcom is same while there is a fluctuating pressure in the expansion stroke after the ignition point. Pmax and power decrease. Injection is done later and smoke increases.


i. Choked intake


Observe that due to a choke intake compression pressure is less throughout the curve. It results in a lower Pcom and Pmax, while exhaust temperature and smoke increases. The turbocharger surges.


Analysis of compression card

When the lines are not coinciding. If the compression card is positive in area and hence, the indicator cam should be retarded. This implies that the indicator cam setting is wrong.


If the compression card is negative in area and hence the indicator cam should be advanced. This implies that the indicator cam setting is wrong.


Analysis of light Spring Diagram
a. Choked intake


The dashed line indicates the ideal curve, while the dark line indicated the actual curve.


b. Early opening of the exhaust valve


Observe the exhaust valve opening point has shifted to an earlier position. Power decreases and exhaust temperatures increase.


c. Late opening of exhaust valve


Observe the exhaust valve opening point has shifted to a later position. Scavenge efficiency decreases and less energy is passes to the turbocharger.


d. Choked exhaust 


Observe that the exhaust is choked, there is less pressure throughout. Exhaust temperatures and smoke increase. Scavenging efficiency decreases and there is a possibility of turbocharger surging.


Faults With Indicator Instruments
a. Vibrations in the indicator instrument drive. Only the power card is affected, while the draw card is not affected.


b. Cord of the indicator instrument is too long. Hence, the TDC section is missing. 


c. Cord is too short. Hence, the BDC part is missing.


d. Friction in the indicator piston. Observe that both power and draw cards are affected. It results in an extra large working diagram area.


e. Weak spring of the indicator instrument. It results in the indicator piston striking the top end of the cylinder.


f. Leaking indicator cock. Observe that the atmosphere datum line is untrue.


All indicator cards faulty indicates that the problem is with spring tension, piston freeness, deposits, linkages, drum cord, clear indicator cock, etc.


Analysis of combustion can best be done by means of an instrument called the Indicator. This measures the variations of pressure during the cycle, in the form of cards. The angle a is a yardstick for the impact of the ignition pulse.
Mainly on account of the compressibility of the fuel, the commencement of fuel delivery by the fuel pump and the commencement of the fuel injection do not coincide in relation to the time.
The result is a time-lag, A — B. The distance B — C represents the Ignition lag. This is the time which elapses between commencement of fuel injection and the first perceivable increase of pressure. The Ignition lag is the characteristic of the fuel. Large lag indicates unsuitability of the fuel.
When the pressure rises rapidly, the combustion and expansion curves show vibrations, due to a fault in the. spring. The diagram is then evaluated, to obtain the actual maximum pressure.


Q. Difference in Peak and Compression pressures?
Ans: It is important to keep the difference between the maximum combustion pressure (peak pressure) and the compression pressure below 40 bar. If this pressure difference is too large, the piston ring may get damaged (ring collapse/breakage).
The combustion gases may pass through the ring pack, resulting in damage to liner, increased heat load on the liner and rings. In extreme cases, this may result in the sticking of the piston rings and hair-line cracks in the liner due to overheating.
The capability of the Piston rings to withstand the pressure shocks depends upon
  • Design and material aspects.
  • Rate of pressure rise.
  • Engine load.
  • Cylinder oil feed rate.
  • Quality of cylinder lubricant.
It is therefore not possible to give any fixed value of pressure difference. An increase in the pressure differential is due to re-adjustment of the maximum combustion pressure. An excessive pressure difference originates from a reduced compression pressure, caused by :
  • Lower Scavenge air pressure.
  • Fouled turbocharger inlet filters.
  • Fouled Scavenge air coolers.
And any mechanical defects such as:
  • Burnt Piston crown.
  • Leaky Piston rings.
  • Worn Cylinder liner.
  • Burnt Exhaust valves.
  • Change in Exhaust valve timing.
An out-of-phase diagram or Draw card is needed to analyze the combustion process, which cannot be easily done in the Power card. In this diagram, the compression curve, the ignition point, the combustion and. the expansion characteristics are clearly distinguishable.


Q. What are the Precautions before taking cards?
Ans: Precautions before taking cards
a. Friction between rubbing components causes distortion of the card. Friction can be reduced by keeping the indicator piston and cylinder clean and lightly lubricated with a few drops of oil.
b. The close fit of piston should be checked, it should be dismantled, and the piston is allowed to fall freely under its own weight.
When the bottom is covered, the piston should hold its position, this will only happen if there is proper sealing, with minimal clearance.
c. The indicator drum should not hit the end-stops, when the cord is connected.
d. There should be negligible 'play' in the stylus linkages.
e. The indicator cock should be free of carbon and combustion residues, by blowing- through before use.
f. The Indicator should only be kept on the cock as long as necessary, else it will tend to over-heat, and give a distorted card. The instrument should be allowed to cool down in between usage.
g. Use proper gloves while handling the Indicator, which provide protection from the heat, without restricting movement

Faults detected from Indicator cards, Draw cards and Light spring diagrams :
a. Early injection
b. Late injection
c. Afterburning
d. Loss of compression
e. Chocked intake/Silencer
f. Chocked exhaust


Q. What is a draw diagram and what information is obtained? 
Ans: A draw diagram is in effect a pressure-time diagram which is obtained by moving the dram at constant velocity during the period covering a few degrees before and after the TDC. A draw card is merely a diagram taken with the drum rotation advanced by 90° to the main piston of the engine. This allows the injection period to be spread out across the centre of the card so that the combustion process can be examined more closely. 
The vital information's obtained are:
  • compression pressure, 
  • maximum pressure of ignition and the 
  • nature of the expansion curve. 
The draw diagram is also a valuable guide to detect any fault as affecting combustion. 
  • Loss of compression, 
  • defective fuel pump timing, 
  • unsuitable fuel 
  • occurrence of afterburning etc.

Q What are the effects of worn fuel injection pump?
Ans: Worn fuel injection pump. This produces a lower maximum pressure, a lower power developed, and usually lower exhaust gas temperatures. 
This is caused by the worn fuel pump pressurizing the fuel within it at a slower rate than normal. However not only is the fuel injection retarded, it is also injected at a lower pressure, causing both less fuel to be admitted, and larger fuel droplets than normal. The combination of these effects would be: Lower cylinder power Late fuel injection Slightly lower exhaust gas temperatures Increased exhaust gas smoke emitted from that cylinder Hence it is vital that all changes in parameters are investigated, so that the actual cause can be more readily identified. Note that when the fuel pump is adjusted to compensate for this wear by only increasing the fuel rack setting, the result would produce similar effects to ' the worn fuel injector, i.e. higher exhaust gas temperatures for the same cylinder power (as the fuel droplets produced will be larger). Hence it is important to advance the fuel timing as well as increase the fuel rack setting to compensate for this fault. The following faults could cause excess wear of the fuel pump: Abrasive particles in the fuel oil such as aluminium and silicon catalytic fines. 
No fuel (acts as a lubricant) or 
Insufficient plunger/barrel clearance.


Q What are the limitations of an indicator cards?
Ans: The pressure sensing point of the cylinder relies on pressure waves being transmitted through a narrow passage. Also the actual place of ignition can occur randomly in the cylinder, which affects the level of pressure transmitted and received. This means that similar 'cylinder' pressures can be registered as slightly different pressures by the indicator unit. Thus readings of power variations may be due to incorrect readings by the indicator unit. 
If an indicator diagram is used to adjust the engine parameters, then we must assume that the single diagram is representative of that cylinder. For an engine running at 100rpm. then in one month 4.3 million cycles occur. It is unlikely all cylinders will continue to exhibit the same power balance profile. 
The calculation of the power of a cylinder can often rely on accuracy of hand traced planimeter. The accuracy of planimeter and hence power calculations will be poor. Electronic indicators have an advantage in this respect. These units use inputs from cylinder pressure and flywheel position. The pressure sensor can measure and record the pressure from sequential cycles. This means that rogue readings will not be used to calculate engine power and hence cause mal-adjustment of the engine power settings. Friction within the mechanical indicator Uneven load on the engine due to changes in the external load conditions over the period when indicator cards are taken Uneven temperature of the mechanical and some electronic indicators 


Q What could lower the compression pressure? 
Ans: As the piston ring and the liner are wearing out, there is a tendency for the compression pressure to be lowered. 
Defective lubrication, wearing out of bearings, burning out of piston crown etc. are other defects which could lower he compression pressure.


Q-State how the Operational Economy can be improved.  
Ans: Following methods can be used:
  • Ship speeds have been lowered. 
  • Reduce engine speed by increasing stroke. .
  • Stem apertures of vessels have been redesigned to accommodate larger diameter propellers. 
  • Hydrodynamic improvements have been introduced by refining stem lines, increasing beam ratios and adding all sorts of propulsion aids. e.g. ducts, fins, vane wheels, bulbs, asymmetric stems, flow straightening nozzles, propeller boss cap fins. etc. 


Q State how Engine balance can be achieved. 
Ans: Engine balance can only be achieved by correcting values in the following order: 
  • Compression pressure; 
  • Crank angle at Pmax point; 
  • Pmax; 
  • Expansion pressure; 
  • Fuel pump index; 
  • Exhaust gas temperature. 


Q what is after burning ?
Ans: After burning means that the burning of the fuel is taking place later in the stroke, displacement in the expansion stroke. The pressure and temperature are likely to be higher as compared to normal diagram for the same piston.


Q. How is Peak or Maximum Pressure Diagram taken? 
Ans: It can be measured between the maximum height of the power or out-of-phase diagram and the base line. Also it is the measure of the vertical lines drawn with fuel pump engaged but the indicator cord not attached to the indicator drive gear. 
 

Q. Why in smaller and higher speed engines the indicator instrument; becomes unsuitable? 
Ans: smaller and higher speed engines the instrument becomes unsuitable for a number of reasons. 
  • When the speed is high the indicator piston, its spring and stylus Will be unable to follow the pressure of the main cylinder due to inertia lag. Too rapid fluctuation of pressure is likely to create oscillations interfering with the proper functioning of the stylus. Higher level of engine vibration is likely to be transmitted to the instrument. 
  • The variation of pressure is large and rapid. A heavy spring does not respond quickly when the cycle pressure is low. When the clearance volume is small the additional volume of the piping leading to the instrument lowers the compression ratio. 
  • The limitation of the indicator instrument is the rate of change of pressure. With higher rate, a helical spring is unsuitable as its natural frequency of vibration is low. 


Q What are the factors that influence a change in Maximum pressure of ignition? Ans: The factors which are likely to influence such a change are as follow:
Increased max pressure: Early injection, use of fuel of higher ignition quality, Fault in the injector.
Decreased max pressure: Late injection fuel of poor ignition quality, Viscosity high or poorly atomized fuel and Loss of compression pressure. 


Q What does expansion curve higher than the normal curve indicates?
Ans: The expansion curve higher than the normal curve indicates after burning. 
 

Comments