
Answer EKM Question 52
A. State the various types of indicator diagrams that are used to assess engine performance;
B. Specify the additional data needed in conjunction with these diagrams;
C. Explain, how some abnormalities in indicator diagrams can be traced to the indicator;
D. Describe the precautions necessary to avoid indicator malfunctions.
Answer: Purpose:
a. To enable the evaluation of the power developed in each cylinder.
b. To highlight conditions during fuel injection, combustion and after burning.
c. To highlight conditions prevailing in the cylinder during the scavenge/exhaust gas exchange process.
d. To show the pressure variations in the cylinder with respect to piston displacements.

Types of Indicator Diagrams:
1. Power Cards (In-Phase)
It plots the pressure variations in the cylinder and can be integrated with a planimeter to calculate the mean indicated pressure. The Power developed in cylinder can be calculated by multiplication of the engine speed and the cylinder constant. It also highlights after burning.

2. Draw Card (90 deg. out of phase)
It is similar to a power card but taken with the indicator drum rotation 90 deg out of phase. It highlights the fuel injection process, point of injection and compression pressure.

3. Compression Cards
The compression card is only a line on the indicator diagram and gives the compression pressure and a Timing check on the indicator cam. It is taken at a reduced rpm with the fuel cut-out.

In an ideal compression card the compression and expansion lines are the same. This shows correct synchronizing of the indicator piston movement with the engine piston movement.
When the lines are not coinciding. If the compression card is positive in area and hence, the indicator cam should be retarded. This implies that the indicator cam setting is wrong.

If the compression card is negative in area and hence the indicator cam should be advanced. This implies that the indicator cam setting is wrong.

4. Light spring diagrams
It is a diagram taken similar to the power card and in phase with the engine but with a light compression spring fitted to the indicator. It shoes the pressure variations during exhaust and scavenge operations.

'A' is the atmospheric line which acts as the pressure datum line. It is taken by turning the indicator cock to a vent position and drawing a horizontal line with the rotation of the drum by its cord.
'B' is the pressure at beginning of compression.
'C-B' is the fall in exhaust pressure after the exhaust valve opens at C.
'C' is the opening of the exhaust valve.
'D' is the opening of the scavenge ports.
'E' is the lowest pressure in cylinder during scavenging.
'F' is the compression line.
Analysis of Indicator Diagrams:
a. Early ignition

Ignition point starts earlier resulting in a higher Pmax, but Pcom is the same. Exhaust temperatures decrease and it may cause knocking. It is corrected by adjusting the FQS setting for bad quality fuel or injection timings.
b. Late ignition after-burning
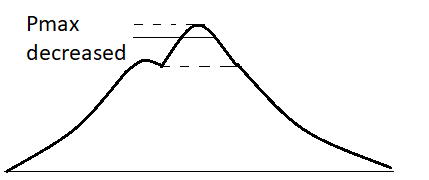
Observe that the ignition point starts later and Pmax is lower but Pcom is the same. Exhaust temperature decrease as more fuel is burnt later and smoke increases. The cause are wrong fuel pump timings, camshaft drive wear, worn fuel pump plunger, faulty delivery valve or suction valve spring, injector nozzle trumplets, or worn injector holes.
c. Pressure Oscillations.

Observe the oscillations are due to the gas column or indicator drive. To use this diagram, take the mean of the oscillation amplitude to get the curve.
d. High compression pressure
Observe that the Pcom is high, resulting in a higher Pmax. Ignition point is higher although there is late ignition.

e. Low compression pressure
Observe Pcom is lower, resulting in a lower Pmax and early ignition.

f. Leaky exhaust valve or worn piston rings

Observe Pcom is lower and ignition point is later. Pmax and exhaust temperature increases, while power decreases.
g. Overloaded engine
Observe Pcom is higher and Pmax is higher. exhaust temperature and smoke increases.

h. Leaky injector or a worn fuel pump

Observe Pcom is same while there is a fluctuating pressure in the expansion stroke after the ignition point. Pmax and power decrease. Injection is done later and smoke increases.
i. Choked intake

Observe that due to a choke intake compression pressure is less throughout the curve. It results in a lower Pcom and Pmax, while exhaust temperature and smoke increases. The turbocharger surges.
Analysis of light Spring Diagram
a. Choked intake

The dashed line indicates the ideal curve, while the dark line indicated the actual curve.
b. Early opening of the exhaust valve

Observe the exhaust valve opening point has shifted to an earlier position. Power decreases and exhaust temperatures increase.
c. Late opening of exhaust valve

Observe the exhaust valve opening point has shifted to a later position. Scavenge efficiency decreases and less energy is passes to the turbocharger.
d. Choked exhaust

Observe that the exhaust is choked, there is less pressure throughout. Exhaust temperatures and smoke increase. Scavenging efficiency decreases and there is a possibility of turbocharger surging.
Faults With Indicator Instruments
a. Vibrations in the indicator instrument drive. Only the power card is affected, while the draw card is not affected.

b. Cord of the indicator instrument is too long. Hence, the TDC section is missing.

c. Cord is too short. Hence, the BDC part is missing.

d. Friction in the indicator piston. Observe that both power and draw cards are affected. It results in an extra large working diagram area.

e. Weak spring of the indicator instrument. It results in the indicator piston striking the top end of the cylinder.

f. Leaking indicator cock.Observe that the atmosphere datum line is untrue.

All indicator cards faulty indicates that the problem is with spring tension, piston freeness, deposits, linkages, drum cord, clear indicator cock, etc.
Comments
Post a Comment